Why Mobile App?
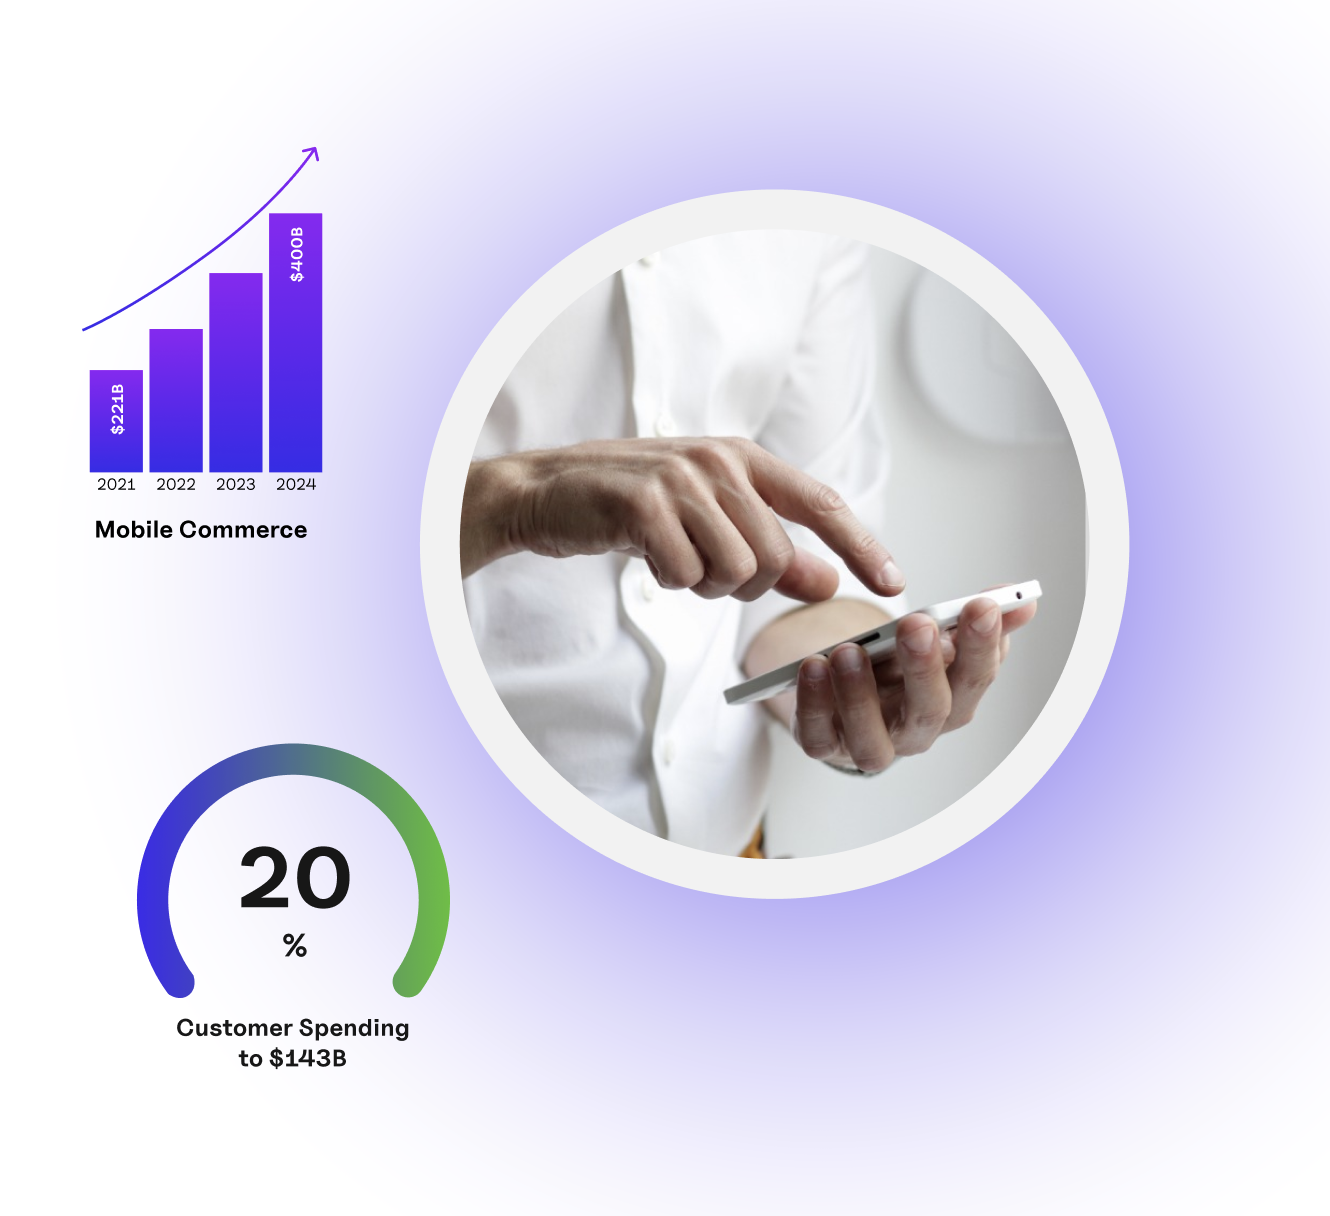
Mobile Commerce Poised for Explosive Growth: Estimated to Double from $221 Billion in 2021 to Over $400 Billion by 2024
Customer Spending in Apps Increases by20% YOY, to $143B
100ms in Page Load Time Can Cost Enterprises 1% in Sales

“First-Time App Installs Increased by 26.1% Year-Over-Year in 2020, Reaching 71.5 Billion Downloads.”
Forbes
Key mobile commerce statistics
77% of US adults now own a smartphone, and 53% own a tablet, highlighting the vast potential for m-commerce
In 2021, nearly one-third of US internet users made purchases using their mobile devices each week.
Mobile devices accounted for 58.99% of web traffic in Q2 of 2022, underscoring their dominance in digital consumption
During the peak of the COVID-19 pandemic, 51% of Americans downloaded at least one shopping app to their smartphone
21% of device users access retail shopping apps multiple times a day, while 35% do so multiple times a week
49% of Americans have used a shopping app to compare prices, indicating a significant trend in digital consumer behavior

Forrester Research: The State of Mobile Shopping Apps in 2022
US Retail Mobile Commerce is projected to grow by 17% annually, reaching new heights by 2024
In-store Consumer Behavior with Mobile Apps:
Checking for promotions, discounts, and product availability before shopping
Utilizing shopping lists and researching products while in the store
Completing transactions post-shopping using mobile apps
APP USAGE GREW ACROSS ALL DEMOGRAPHICS IN 2023
30%

Boomers
30%

Gen X
18%

Millenials
16%

Gen Z


